Monitoring and Alerting with Prometheus in AWS
This is a tutorial on how to monitor your stacks in AWS.
The CloudFormation resources are posted on our GitHub account. Simply clone the repository and use the cloudformation-template.yaml files to launch the specific resources. The resource links are posted at the end of this page.
What is Prometheus?
Prometheus is an open-source systems monitoring and alerting toolkit originally built at SoundCloud. Since its inception in 2012, many companies and organizations have adopted Prometheus, and the project has a very active developer and user community. It is now a standalone open source project and maintained independently of any company. To emphasize this, and to clarify the project's governance structure, Prometheus joined the Cloud Native Computing Foundation in 2016 as the second hosted project, after Kubernetes.
Prometheus's main features are:
- a multi-dimensional data model with time series data identified by metric name and key/value pairs
- a flexible query language to leverage this dimensionality
- no reliance on distributed storage; single server nodes are autonomous
- time series collection happens via a pull model over HTTP
- pushing time series is supported via an intermediary gateway
- targets are discovered via service discovery or static configuration
- multiple modes of graphing and dashboarding support
How does it look ?
Well, let's deploy a simple stack and find out.
- Login to the AWS console and browse to the CloudFormation section
- Select the cloudformation-template.yaml file
- Do not set the Consul parameters at this point!
- Before clicking "Create", make sure that you scroll down and tick the “I acknowledge that AWS CloudFormation might create IAM resources” checkbox
- ...drink coffee...
- Go to the URL in the output section for the environment that you want to access
Main resources created
- 1 AutoScaling Group
- 1 Elastic Load Balancer
- 1 DNS record (for ease of access)
Thoughts?
Assuming that everything went well, when opening the first time your Prometheus stack in a browser, you should be able to see something like this:
After spending some time browsing around, you'll notice a few "nice" things. Let's take them one by one.
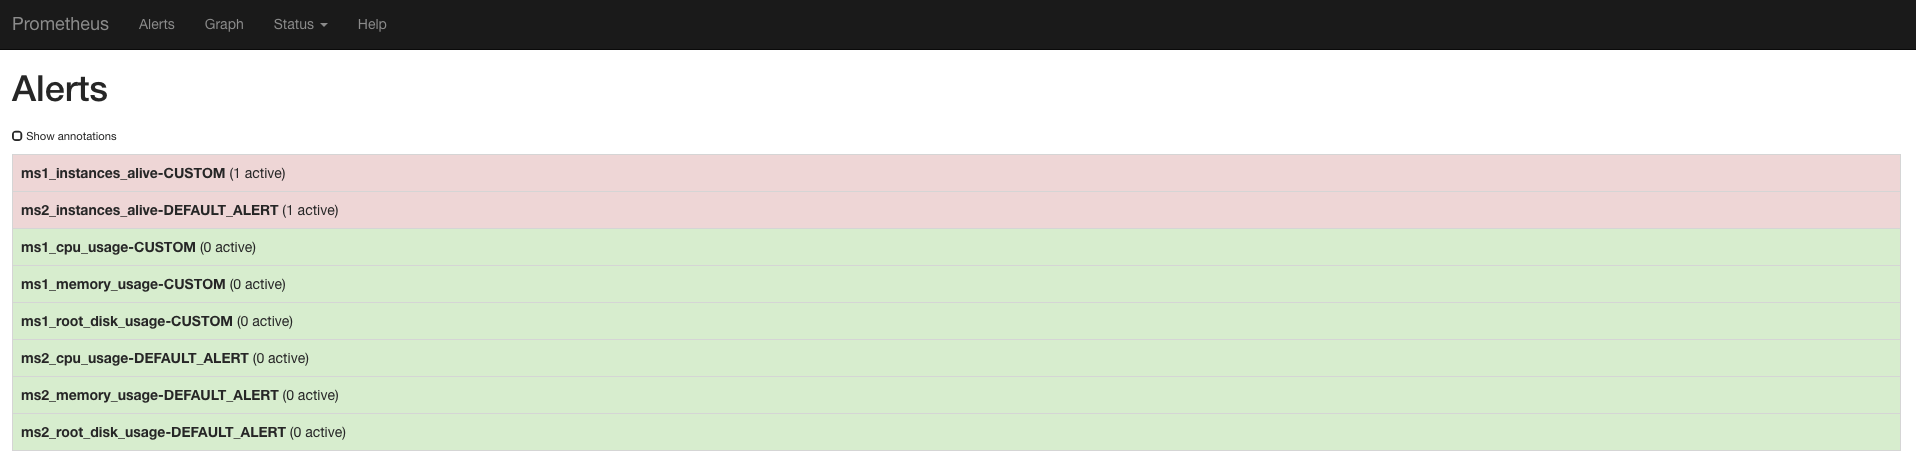
Alerts
The alerting tab will show you all the alerts that have been defined for this specific stack.
The alerts themselves are nothing much but simple rules which trigger an event when specific condition is met -> eg your critical threshold is being surpassed by any specific metric.
In order to modify, add or remove these targets, you'll have to edit the Alerting Rules configuration file and refresh your stack.
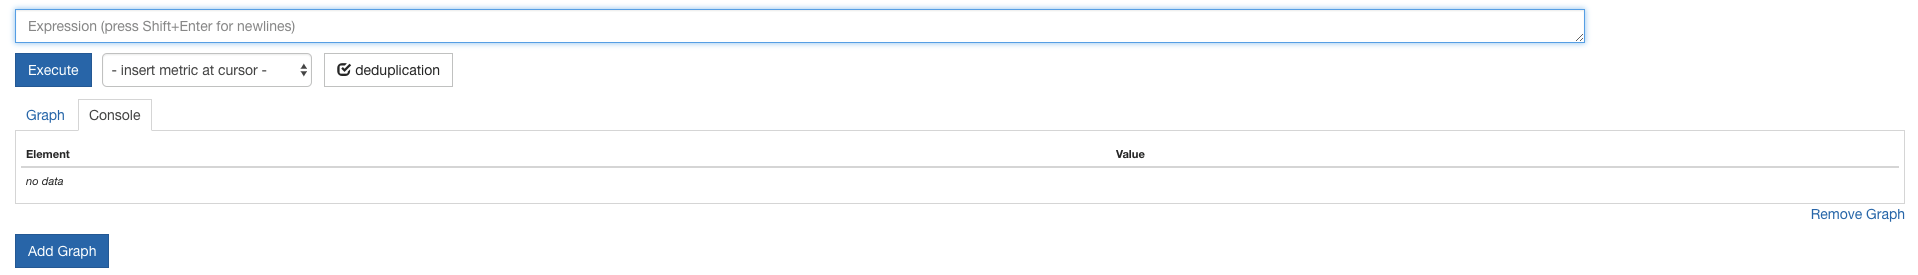
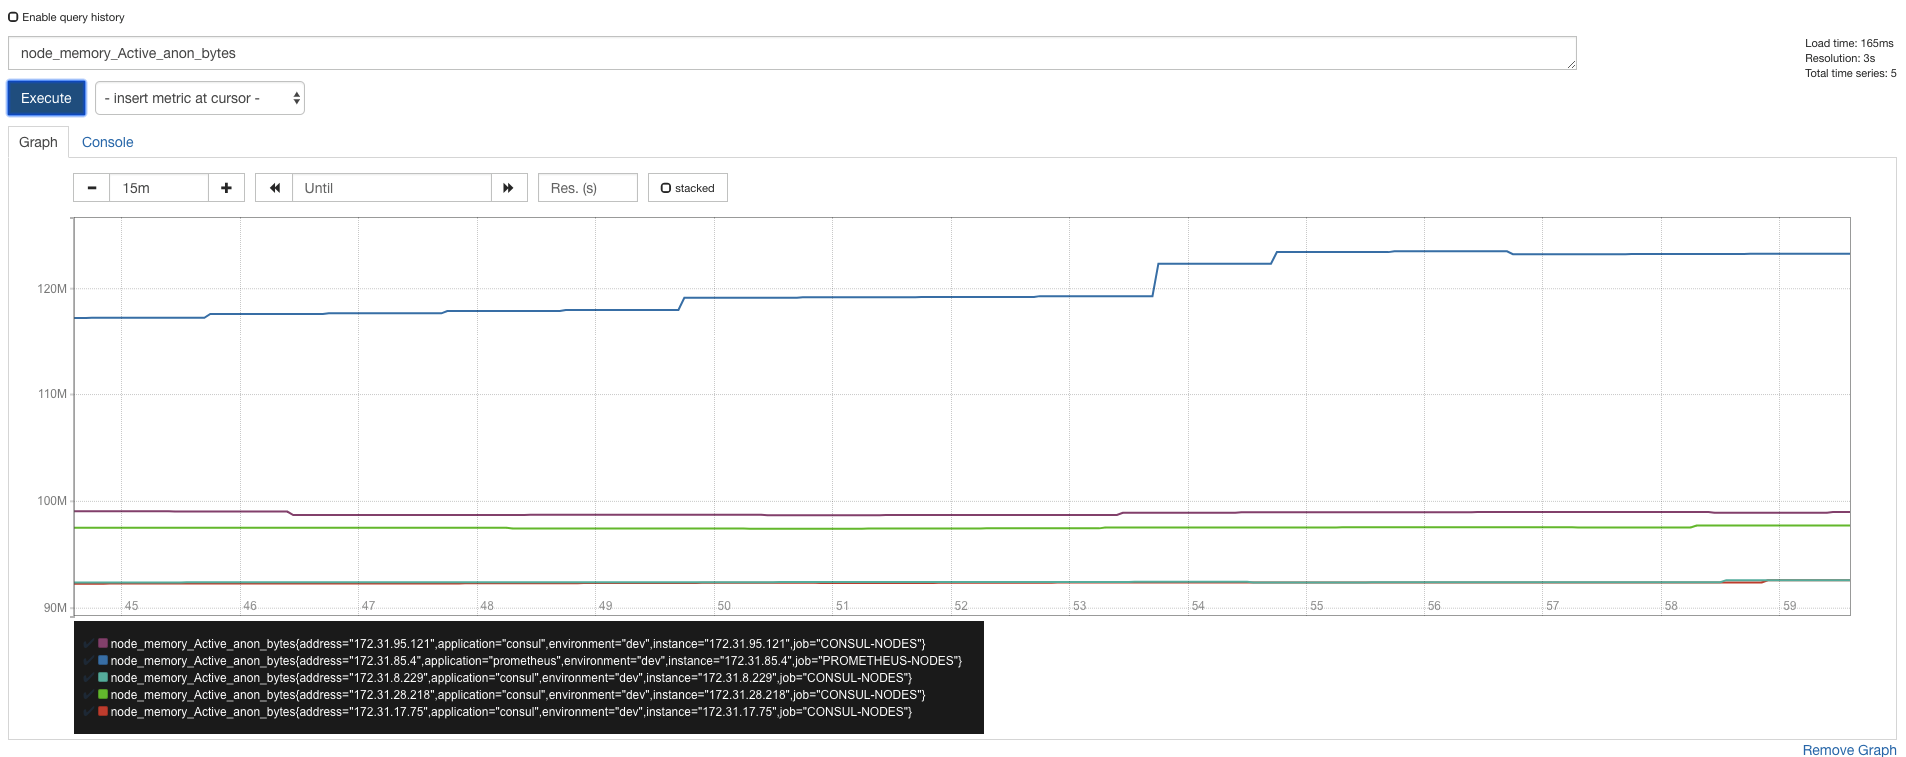
Graphs and metrics
The metrics constitute the core logic of Prometheus, and it's the collection, storage and display of them that makes it so powerful.
In order to fetch them, Prometheus uses a scraping mechanism, which, for a list of targets pre-defined, it queries an HTTP endpoint to fetch granular data that it then stores in its timeseries database.
As a simple visualization tool, this specific "Graph" section is built just for that -> display a plot of data using its timeseries database.
The querieing logic behind it is very powerful and allows numerous ways of filtering and agregating specific sets of data. More on this here.
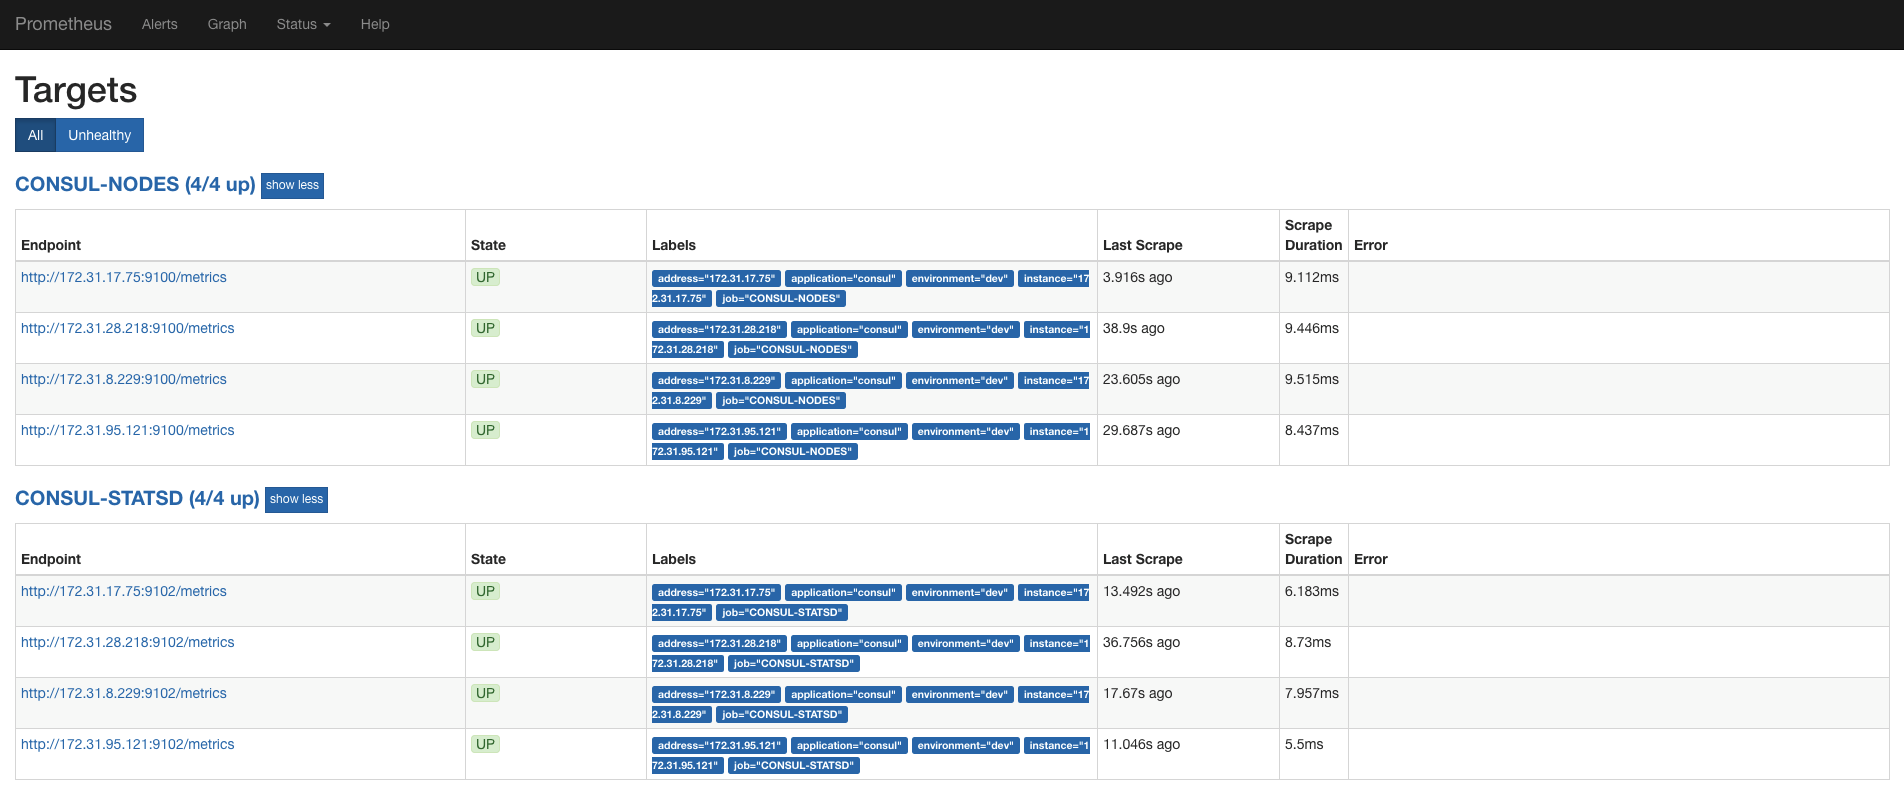
Targets
The targets, as the name says so itself, contains a list of endpoints which the user (you) has defined as wanting to be monitored.
In order to modify, add or remove these targets, you'll have to edit the Prometheus configuration file and refresh your stack.
After you're happy with the amount of targets, you've added, you'll notice that at a specific interval of time (default 60 seconds), Prometheus scrapes all the targets and fetches any new information that the exporter running on that target presents.
Alert receivers ?
If you're asking yourself "Awesome, but how do I set the receiving channels for these alerts?" then give yourself a pat on the back!
The actual sending/receiving mechanism behind alerts is not part of the Prometheus stack itself, but of Alertmanager instead, which is a software built by the same organization of course.
Alertmanager
Alertmanager handles alerts sent by client applications such as the Prometheus server. It takes care of deduplicating, grouping, and routing them to the correct receiver integration such as email, PagerDuty, or OpsGenie. It also takes care of silencing and inhibition of alerts.
Alertmanager's main features are:
- Grouping: Grouping categorizes alerts of similar nature into a single notification. This is especially useful during larger outages when many systems fail at once and hundreds to thousands of alerts may be firing simultaneously.
- Inhibition: Inhibition is a concept of suppressing notifications for certain alerts if certain other alerts are already firing.
- Silences: Silences are a straightforward way to simply mute alerts for a given time. A silence is configured based on matchers, just like the routing tree. Incoming alerts are checked whether they match all the equality or regular expression matchers of an active silence. If they do, no notifications will be sent out for that alert.
- High Availability: Alertmanager supports configuration to create a cluster for high availability. This can be configured using the --cluster-* flags.
How does it look ?
Well, let's deploy a simple stack and find out.
- Login to the AWS console and browse to the CloudFormation section
- Select the cloudformation-template.yaml file
- Before clicking "Create", make sure that you scroll down and tick the “I acknowledge that AWS CloudFormation might create IAM resources” checkbox
- ...drink coffee...
- Go to the URL in the output section for the environment that you want to access
Main resources created
- 1 AutoScaling Group
- 1 Elastic Load Balancer
- 1 DNS record (for ease of access)
What does it do?
Well, first of all, you won't notice anything out of the ordinary unless an alert actually goes out!
The actual sending/receiving mechanism behind alerts is defined through a configuration file similar to the one we provides in the samples directory. Check the static/alertmanager.yaml definition as a reference.
In it, a list of receivers and channels can be defined based on any grouping mechanism that you'd like, such as microservice name, environment, metric type, etc.
How does this scale with multiple teams involved?
Awesome question. Let's think about this for a second...
Although Prometheus is perfectly capable of scraping and parsing numerous amount of targets, it's not really feasible from a DevOps point of view to continuously handle a list of static server definitions, now is it?
And nevermind the servers, but what do we do when multiple teams want different methods of receiving their alerts based on the urgency of the metric and the specific channels that they use?
And moreover, do we actually want to spend time in maintaing all of this ?
The answer is of course -> Hell no!
To tackle this specific problem, let's use a service discovery mechanism for fetching new targets and key-value store to maintain configuration data for our teams.
If you haven't already, now it's time to deploy a Consul cluster with the method we talked about in a post before.
Highly-configurable Prometheus cluster
Let's update the stack.
- Login to the AWS console and browse to the CloudFormation section
- Select the cloudformation-template.yaml file
- NOW modify the Consul logic!
- Before clicking "Update", make sure that you scroll down and tick the “I acknowledge that AWS CloudFormation might create IAM resources” checkbox
- ...drink coffee...
- Go to the URL in the output section for the environment that you want to access
Remember to make sure that your configuration paths now point to the new consul-template files. If you want to see how would this look, check our sample generated-consul-template files.
Targets - What changed?
Well, that would be actually one of the first things you'd notice. You should now see a higher number of targets, with much more labels.
The best part of this is that now, you don't have to make sure you update the config file each time a server goes up or down.
Alerts - What changed?
You'll notice that now the alerts have multipled and are being set up using CUSTOM and DEFAULT values for each microservice in particular.
Granted, some key-value configuration should've been added in your Consul server, but we're pretty sure you're able to handle that yourself, aren't you?
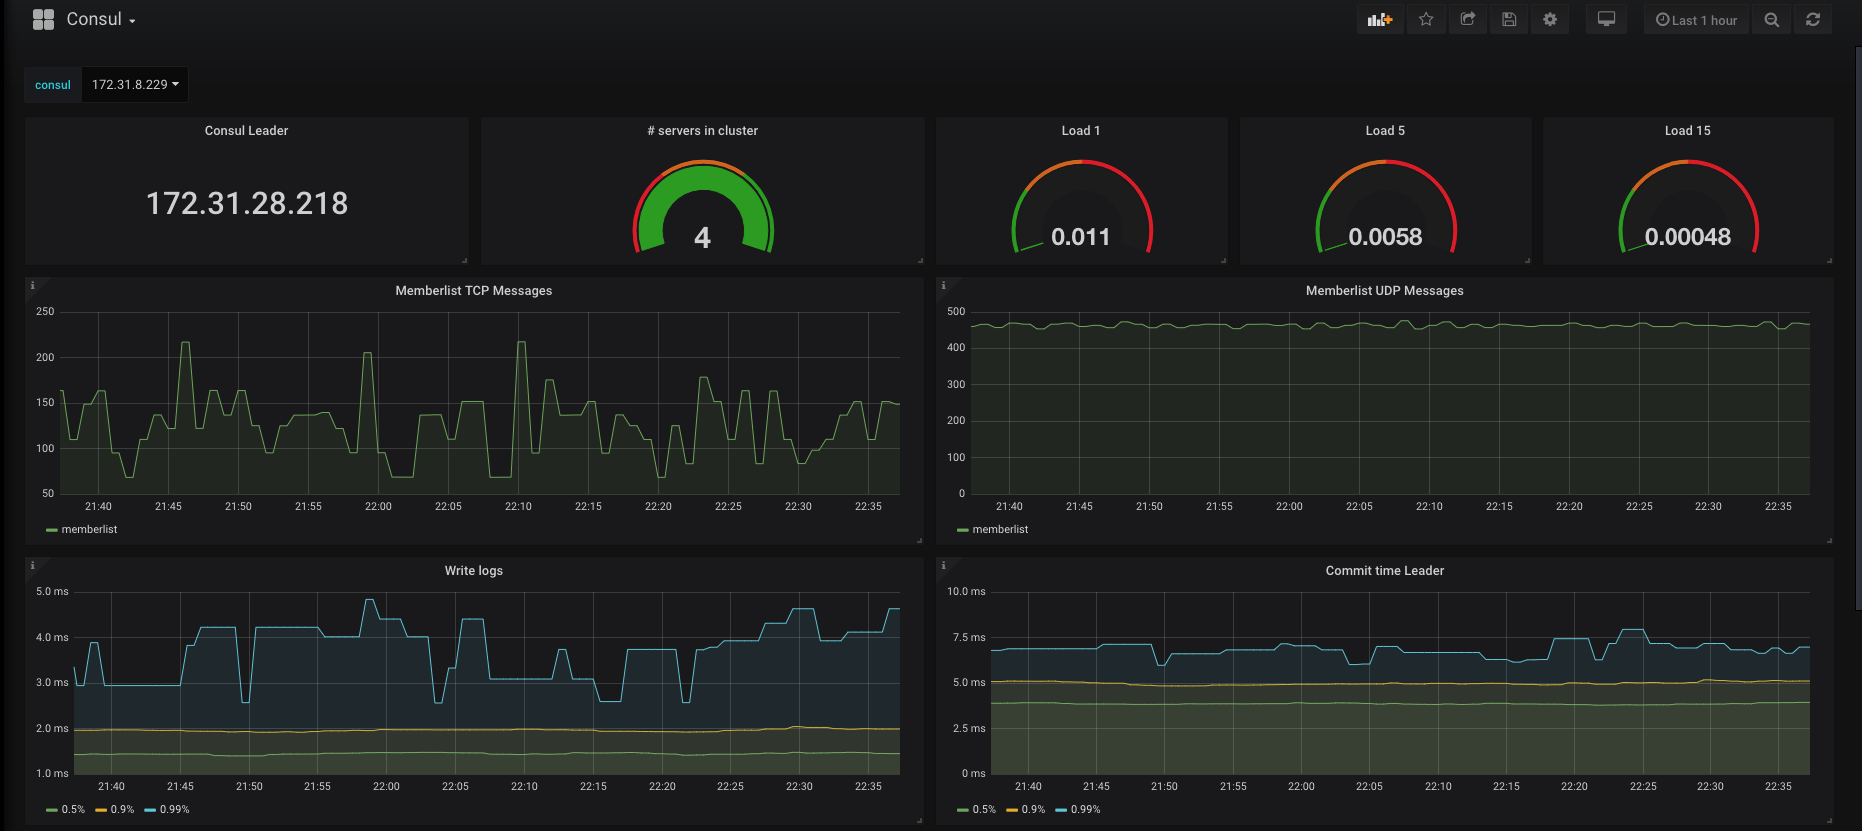
Making it pretty
After all of this being said and done and after browsing around the different available metrics and querying operators/filters, you'll start to grow bored of the lame-looking Graph interface that Prometheus offers.
Not to worry though, Grafana's here.
For those of you who lived under a rock these few years, Grafana allows you to query, visualize, alert on and understand your metrics no matter where they are stored and it's the industry de-facto in regards to designing and sharing pretty dashboards.
All you have to do to integrate is to add your Prometheus URL (for which support exists out-of-the-box in Grafana) as a datasource and then start building dashboards.
And if you're a bad designer (like myself), just check the Marketplace for something that you like and works well.
If everything went well, you should be able to see something on the lines of this:
Resources used
As promised, here are the links to everything we discussed above:
- https://github.com/netbears/alertmanager-cluster-aws
- https://github.com/netbears/prometheus-cluster-aws
- https://github.com/netbears/consul-cluster-aws
- https://github.com/netbears/thanos-cluster-aws
Final notes
Need help implementing this?
Feel free to contact us using this form or via email at